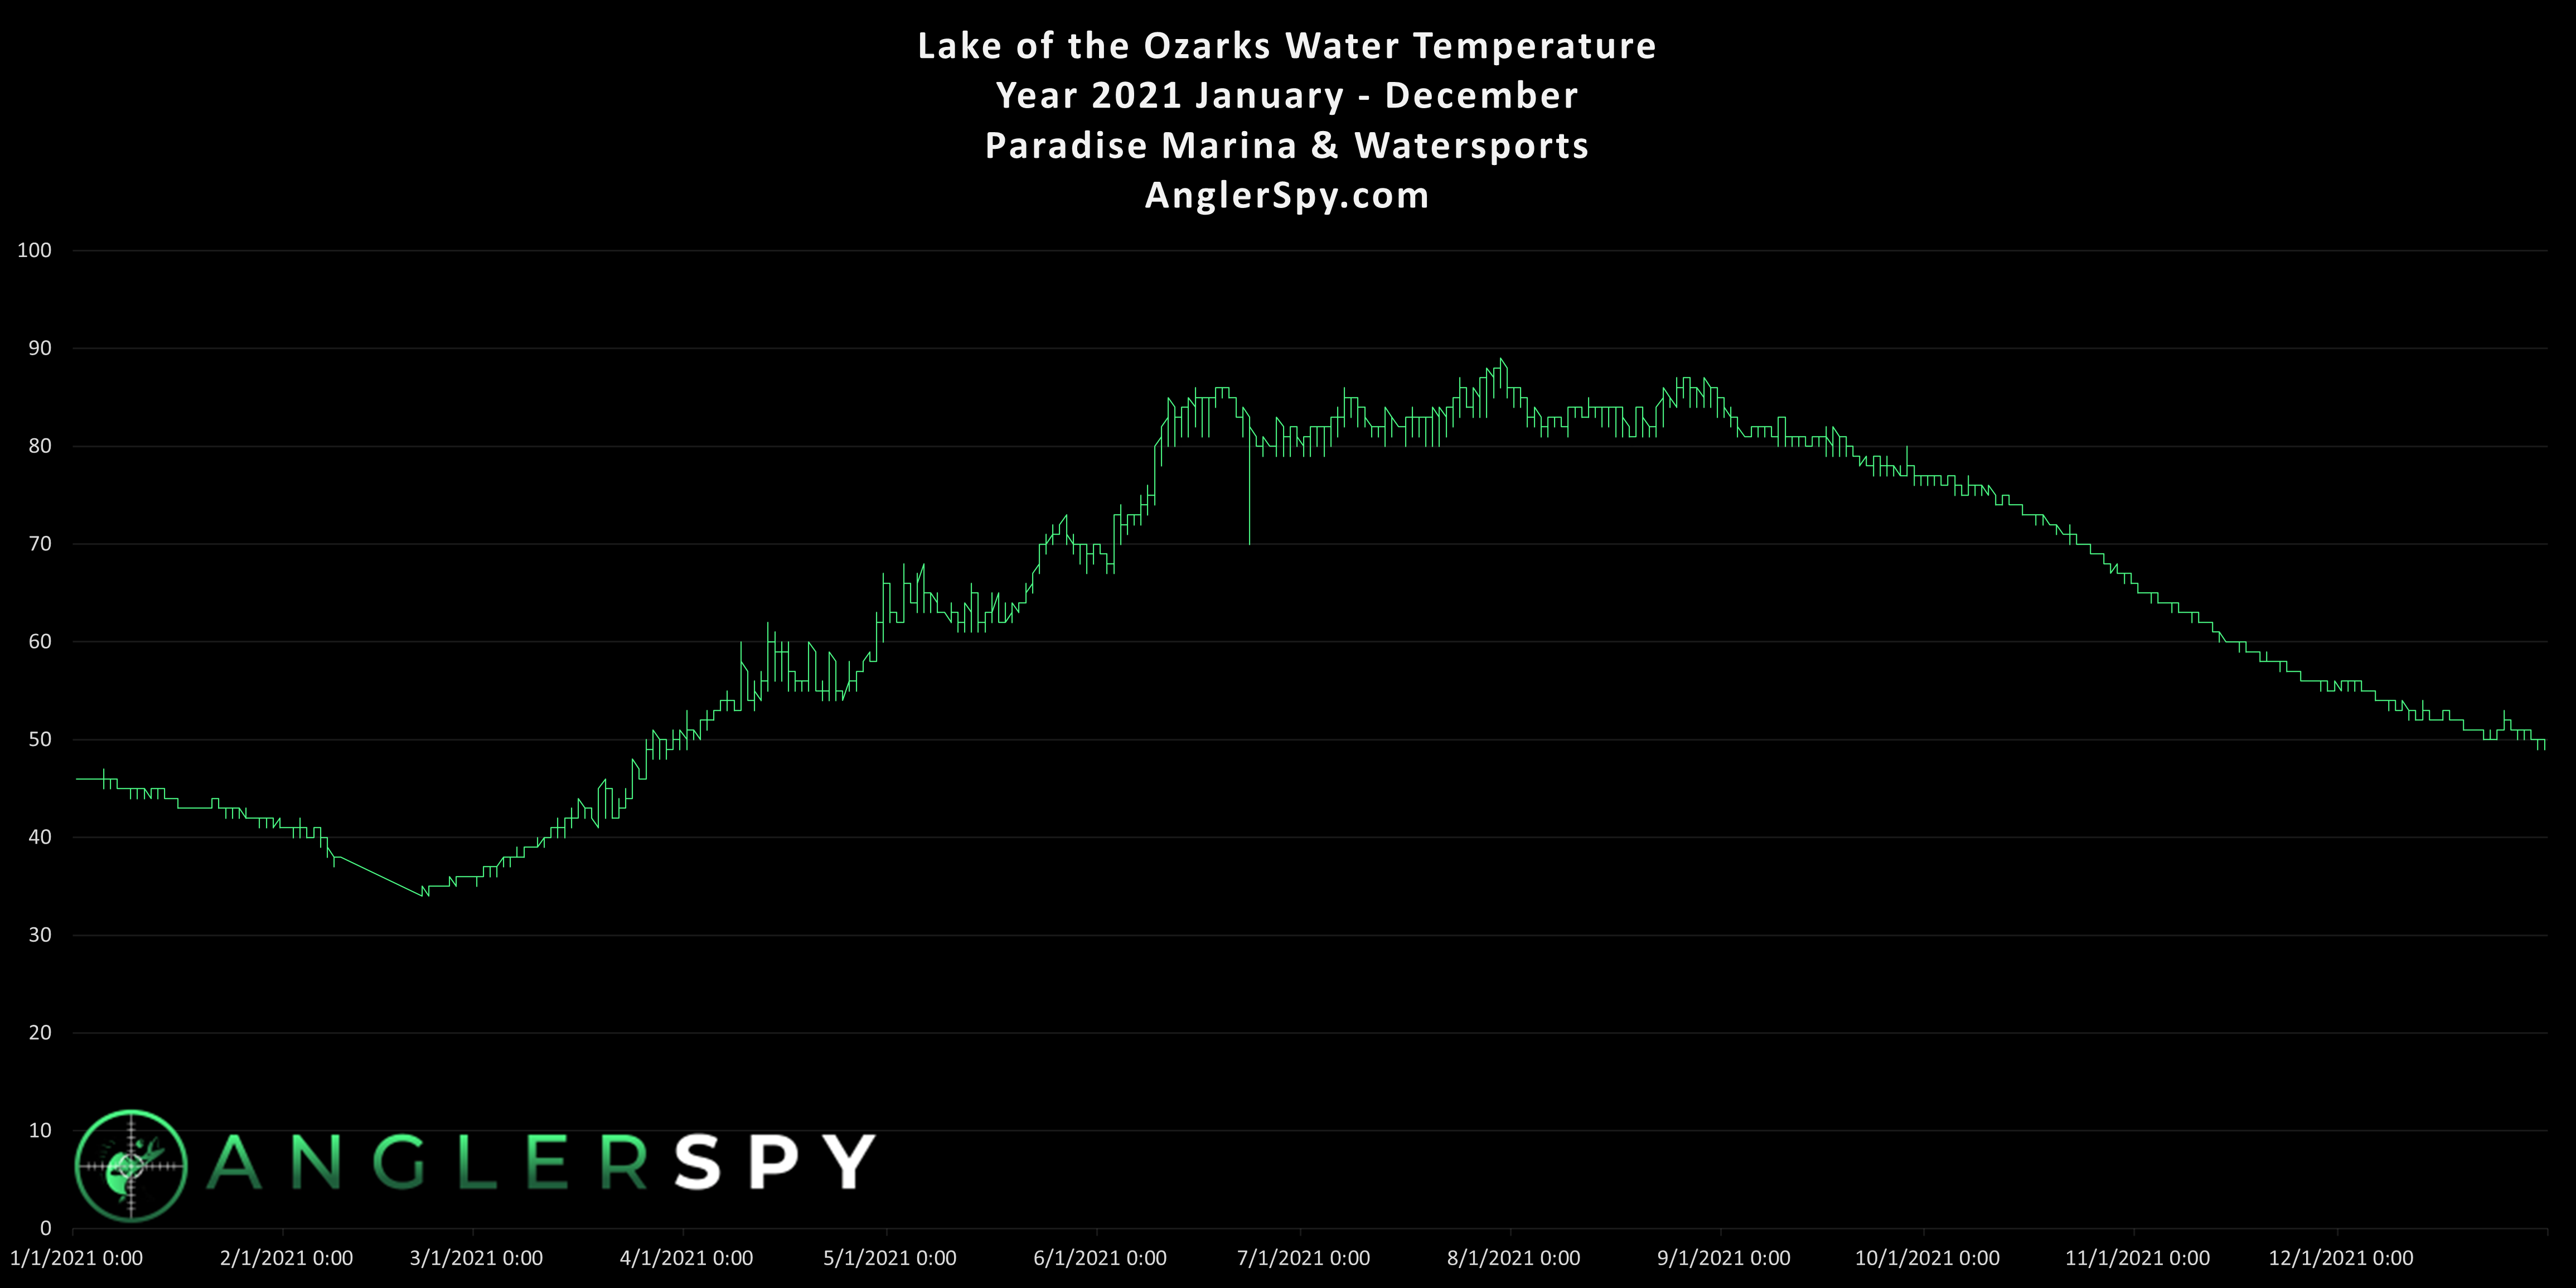
Here in a line graph showing all daily water temperatures for Lake of the Ozarks for January through December of all of 2021. The vertical lines represent the daily change in water temperature.
Tip: if you click on the image, it will take you to a page with only the image where you can download or pinch to zoom so you can better see the detail.
< Go Back to all Historic Lake of the Ozarks Water Temperatures