Here you can find exclusive Table Rock Lake water temperature data by month as well as some basic water temperature facts about Table Rock Lake.
Curious of the water temperature today? We also show the current Table Rock Lake water temperature along with 7 Day & 30 Day historic water temperatures.
We have water temperature data from almost 4 years (as of 2020) of monitoring lake water temperatures and we have analyzed it to produce the information in this post. We record the water temperature every hour, 24 hours a day, 365 days per year on Table Rock. There are minor gaps in the data but overall, we’ve compiled a large amount of data over and extended period of time. This data is available only from Angler Spy™.
To our knowledge, never before has so much water temperature data from Table Rock Lake been recorded. We hope you enjoy and somehow find it useful!
Data use? If you have a use for data, let us know.
How cold does the water temperature on Table Rock Lake get?
The coldest water temperature we’ve recorded for Table Rock Lake was 41° F on March 5th, 2019.
How warm does the water temp of Table Rock get?
The warmest temperate we have on record for Table Rock Lake was 89.3° F on July 11, 2018.
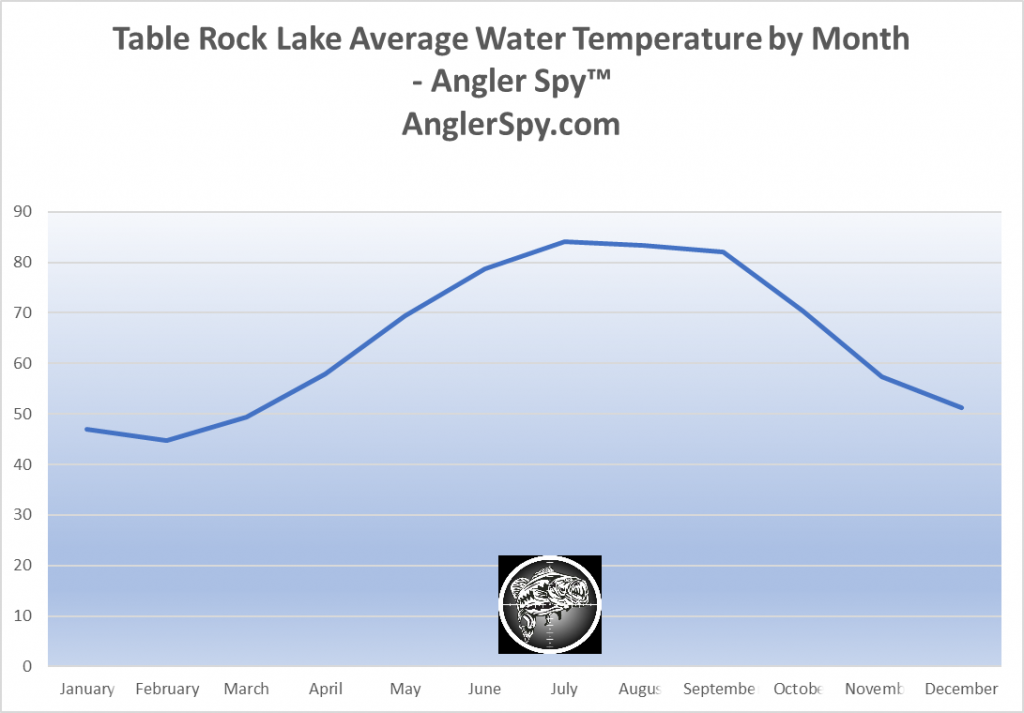
Average Table Rock Lake Water Temperature By Month
Here are the average water temperatures for Table Rock lake by month from 2018 and 2019.
- Month | Average Water Temperature ° F
- January | 46.98°
- February | 44.78°
- March | 49.32°
- April | 57.85°
- May | 69.36°
- June | 78.74°
- July | 84.06°
- August | 83.43°
- September | 82°
- October | 70.28°
- November | 57.40°
- December | 51.21°
The water temperature of Table Rock Lake is warmest in July, averaging 84.06°. It is coldest in January, with an average of 46.96°.
Here is a handy Table Rock Lake water temperature by month chart:

That’s all for now regarding Table Rock Lake water temperatures by month, we hope you find it useful!