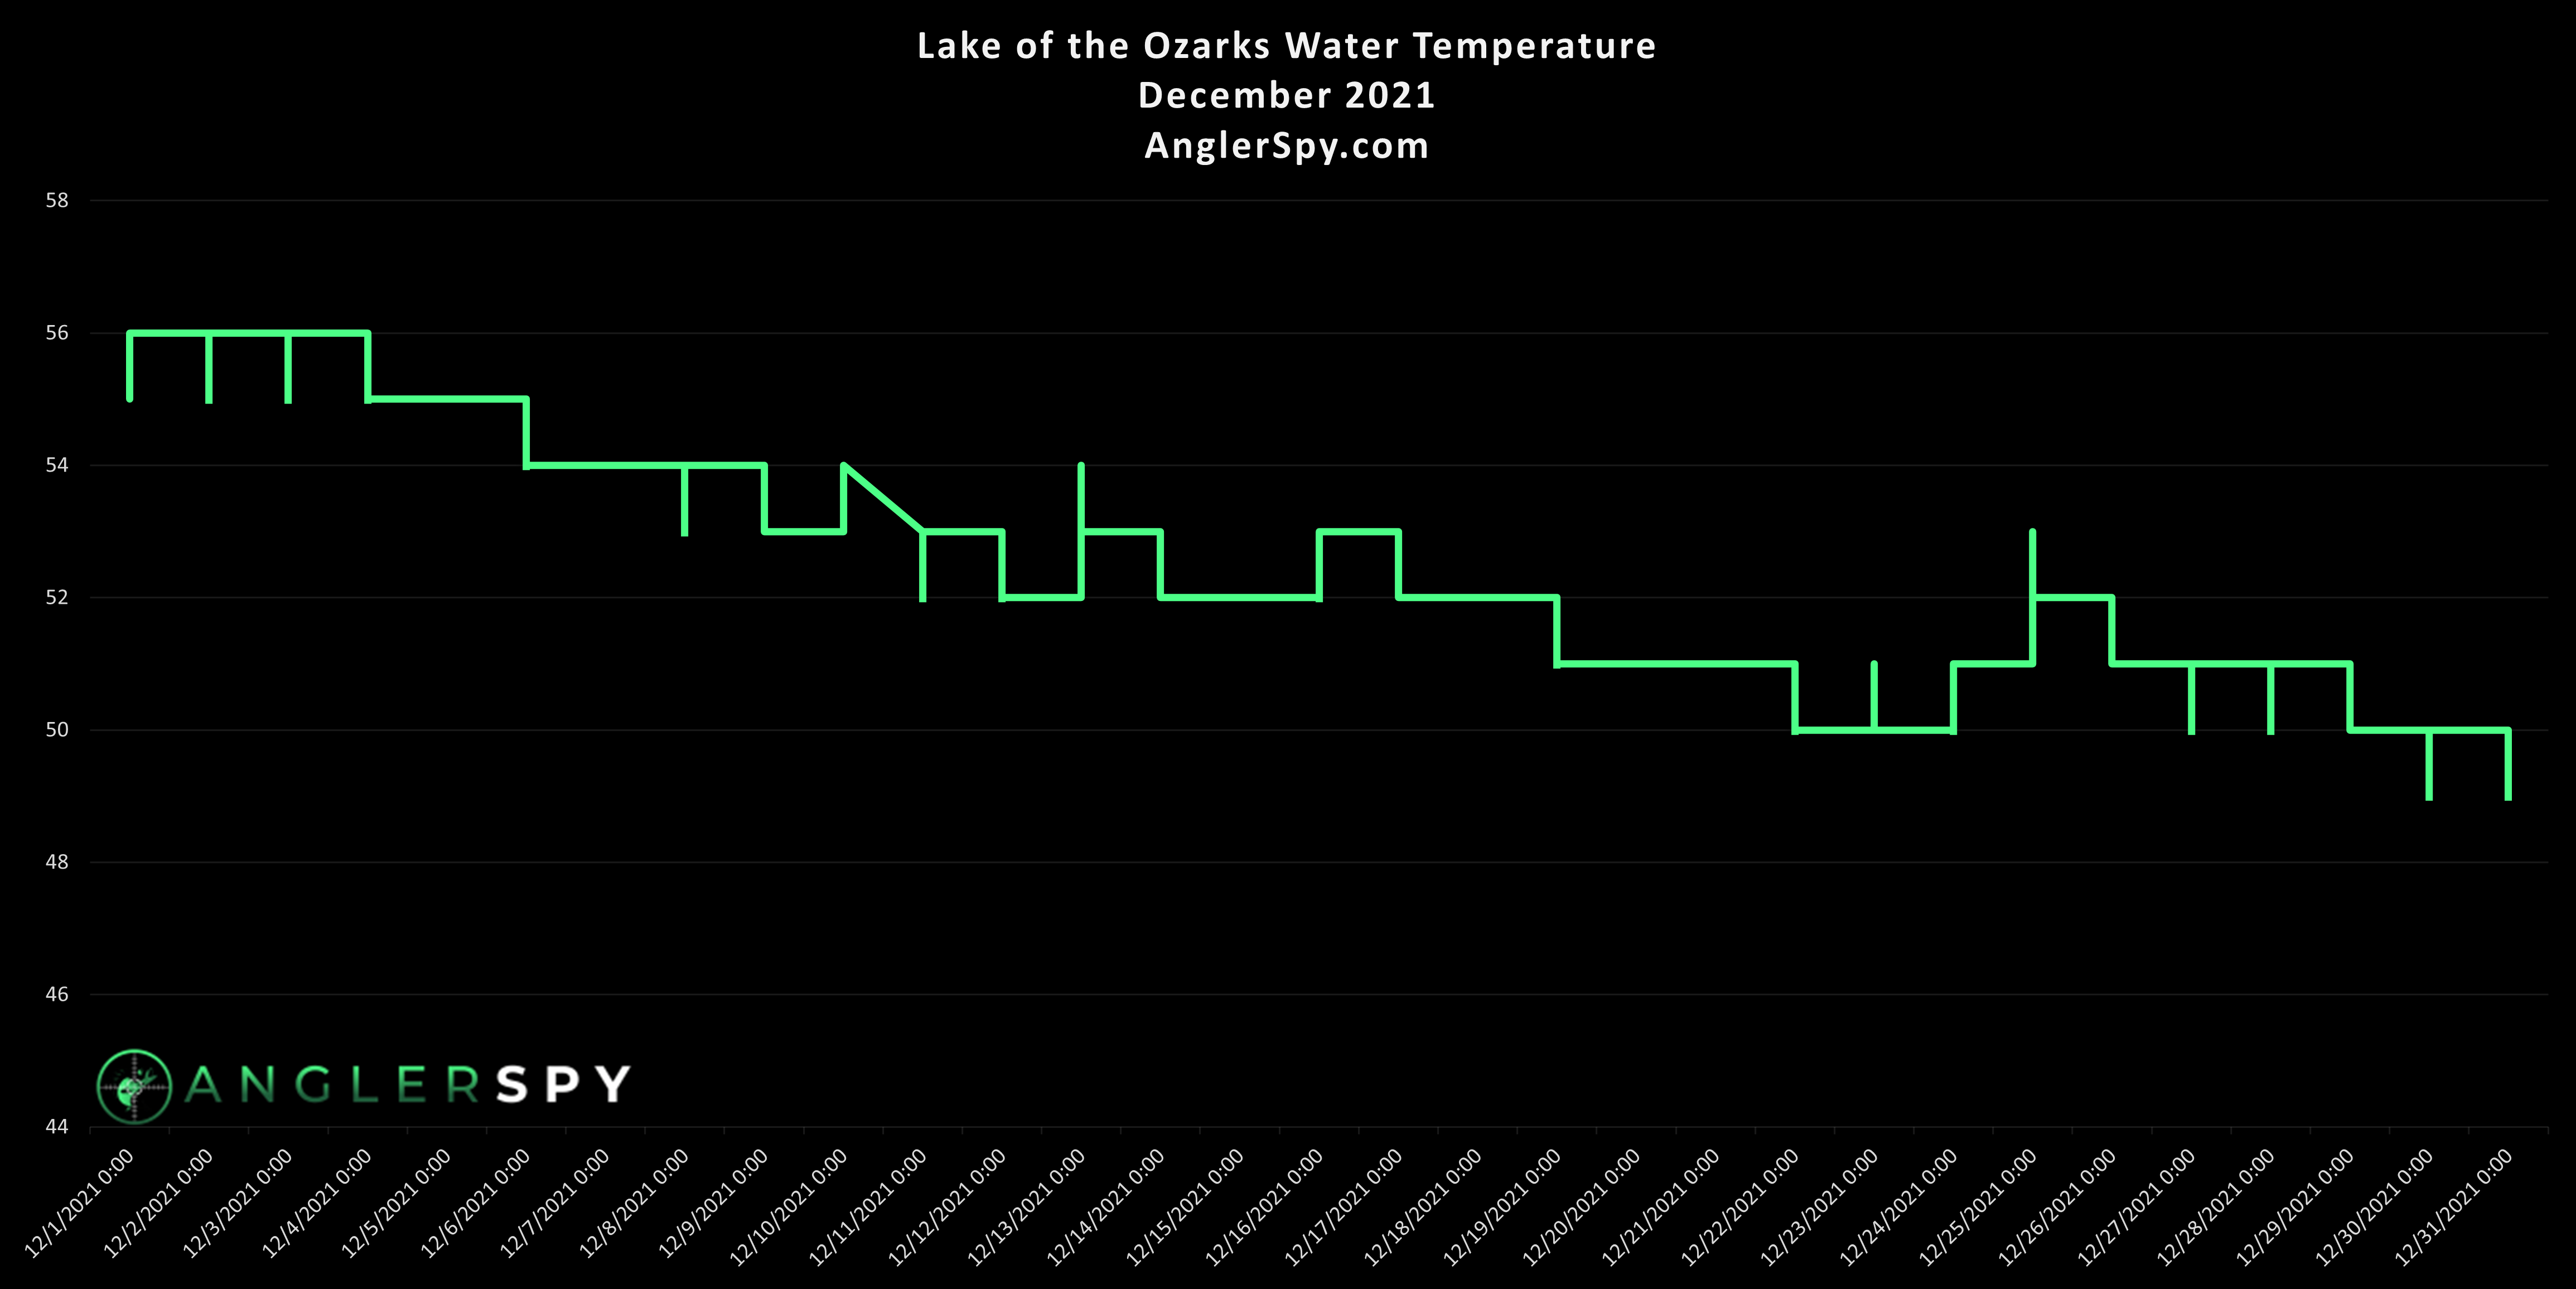
Here is a graph of daily water temperatures for Lake of the Ozarks from December of 2021. The vertical bars represent the daily fluctuations in water temperature.
You might also be interested in the Average Water Temperature by Month for Lake of the Ozarks or the current Real-time water temperature for Lake of the Ozarks.
Additionally, you can check all Historic Lake of the Ozarks Water Temperatures here.