Take a look at the Table Rock Lake water temperature from October 10th through November 10th for 2019, 2021, and this year (2022). There is not data for this date range for 2020 – an odd year for everything!
Recently, I got an email with questions about how the water temps on Table Rock this fall compared to previous years at the same time. He’s doing the same thing at the same time in the same places, but having less success. If it were me, it would be because I was a terrible fisherman…
But could it have anything to do with the water temperature? What could it be? Like any good troubleshooter, he’s trying to eliminate potential causes. We have water temp data from 3 years for the date range in question. Let’s take a look.
To see if water temperatures could be a culprit, I pulled water temperatures for Table Rock Lake from a 30-day date range for this year and compared them to 2 previous years of the same date range. In particular, the charts below represent date ranges from three years:
- October 10th through November 10th of 2019
- October 10th through November 10th of 2021
- October 10th through November 10th of 2022
- Data from 2020 is not available for that particular range.
We can start with the basics…
What was the water temperature at the beginning of these ranges for each of the 3 years?
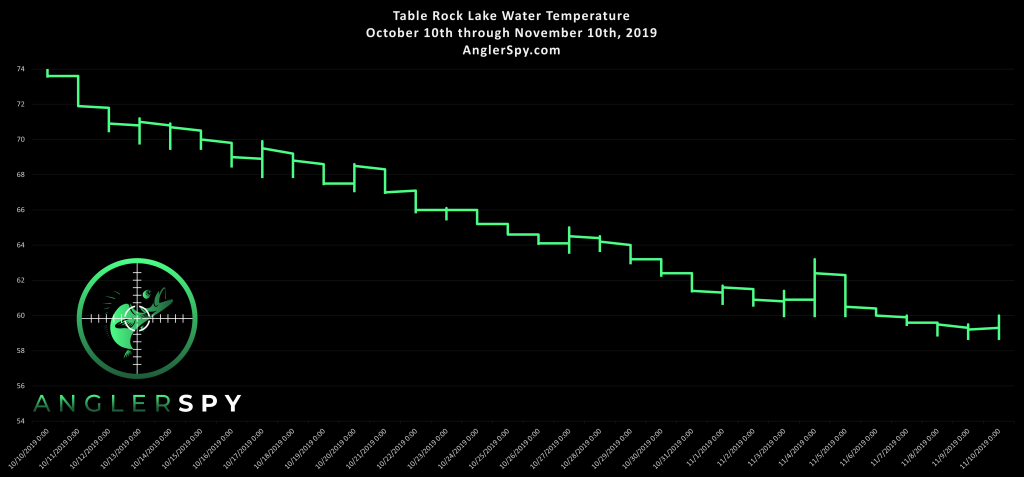
- October 10th, 2019: 74°F
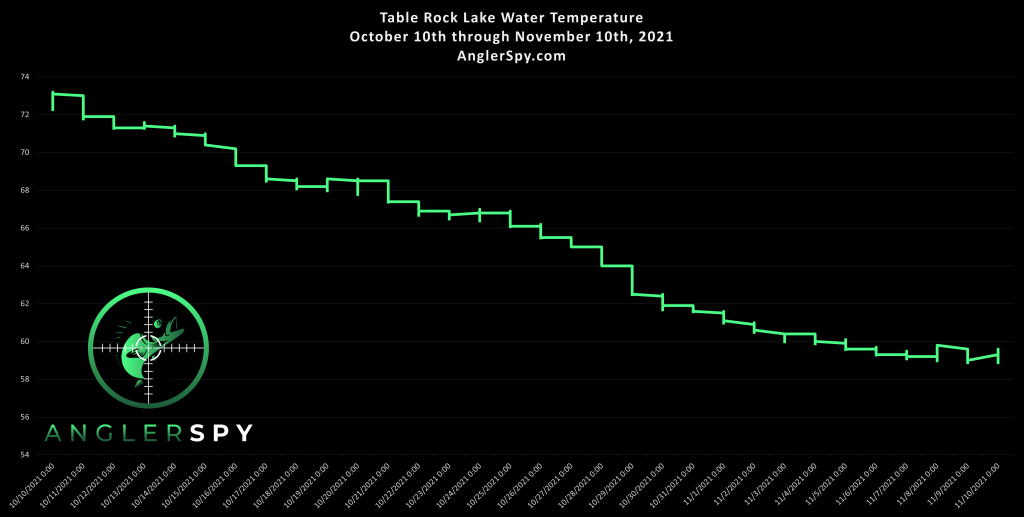
- October 10th, 2021: 73°F
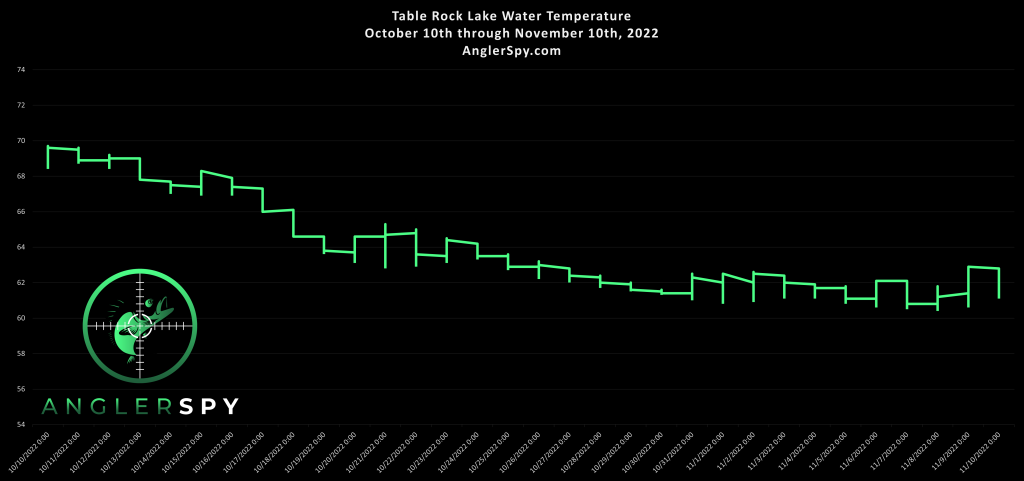
- October 10th, 2022: 69°F
69° on October 10th of this year is a decent departure from past years, but seasons change somewhat differently each year. Noted. Let’s move on…
Next, let’s check out the water temperature of Table Rock on the ending date of our date range in question, November 10th:
- November 10th, 2019: 59°F
- November 10th, 2021: 59°F
- November 10th, 2022: 62°F
As you can see, we’re a little warmer this year compared to the previous years. 3° isn’t huge, but may be impacting fish behavior.
Graphs By Year
In order to “see” what is going on, I graphed each date range from each year in question. As I have mentioned, each graph is depicting a date range. Additionally, in order to see the “daily change” in water temperature, I have used the same scale on the temperature axis.
Each graph uses a low-end temperature of 54°F and a high end of 74°F so that we can see the straight up & down vertical lines that represent the change throughout a given day. These are the “highs & lows” of the water temperature over the course of a 24-hour period.
More vertical lines on a graph = more fluctuation in water temperature per day. As you scroll through the graphs below, keep an eye on the vertical bars that represent daily changes. Also keep on eye on how steady, or erratic, the water temperature decreases over the 30-day period each year.
2019 Table Rock Lake Water Temperature

2021 Table Rock Lake Water Temperature

2022 Table Rock Lake Water Temperature

What is different this year?
We typically provide you data, not opinion, so this is new territory. But my immediate observations when looking at these three graphs all seem to come back to a common theme: consistency. And while we don’t have a huge volume of data, we only have 3 seasons here, one of these is not like the other…
Start & End Temperatures
Both 2019 and 2021 started the date range on October 10th at similar water temperatures in the low-to-mid 70’s. To be exact, 2019 started at 74°F while 2021 started at 73°F. When we look at water temperatures at the end of the date of November 10th, both ended at exactly 59°F. I’d call those two years quit similar if you asked me.
But when we look at the current year, the water temperature of Table Rock started cooler than the other years at 69°F but actually ended warmer at 62°F. Interesting to note.
Range of Temperatures
Since we know the above information we can also figure out that the lake cooled off more in the date range we’re looking at in both 2019 and 2021 when compared to 2022:
- In 2019, the lake cooled from 74°F to 59°F, cooling down 15°F.
- In 2021, the lake cooled from 73°F to 59°F, cooling down 14°F.
- But is 2022, the lake only cooled from 69°F to a low of 62°F, which is only 7°F.
In other words, the lake water temperature basically changed 1/2 as much in the same span in 2022 as it did in previous years. It changed less. Another interesting point to note.
Daily Fluctuations in Water Temperature
One thing that stuck out to me is the significant and more rapid daily fluctuations in water temperature from November 1st through November 10th on the graph for 2022. Not only did the lake only cool off 7°F over the entire date range, the more prominent vertical bars over the last 10 days of the graph mean that throughout that 24hr period, the water temperature changed a decent amount. It rose and fell between 2-3°F for a week and a half.
I am not sure what this means, but I do know it is different than both 2019 and 2021. Those graphs show a fairly steady fall October 10th to November 10th. Just looking at the line graph, both are a gradual decline without too much variation throughout each day. But when we get to 2022, the line is even more of a gentle decline and shows a lot of ups and downs within that 7°F range mentioned earlier.
Takeaways
As I mentioned, these are simply observations and now I am getting into some opinion. Could the slower cooling of the lake affect fish behavior? Does the rapid change, the 2-3°F over the course of each day at the end of the 2022 date range, affect fish behavior? When you think about how we behave when the weather is hot then cold then hot again, with big fluctuations each day, could it be that fish are “thrown-off” some as well when their environment changes so much? Could it be that when the lake only cooled 1/2 as much in 2022 as it did in previous years, the fish responded differently?
I don’t have answers to these questions, but I will continue researching. The most I can do is provide the data and for now, I’ll leave the rest to you. We also have a handy Table Rock Lake Water Temperature by Month post if you’re curious how it changes over the year. We plan on updating it soon with 2022 data. In the meantime, leave a comment below or get in touch if you have any thoughts. Thanks, and good luck out there.